Petroleum refers to any naturally occurring hydrocarbons that are found beneath the surface of the earth, no matter whether these hydrocarbons are solid, liquid or gas. The solid and semi-solid forms of petroleum are called asphalt and tar. Whereas liquid petroleum is called crude oil if it is dark and viscous, or condensate if it is clear and volatile. And of course there is natural gas, which can be associated with oil, or found entirely by itself.
Mankind has used the various forms petroleum for centuries. The Babylonians used asphalt to pave paths and caulk boats, and the ancient Egyptians used tar to prepare their mummies. In fact, mummy is a derivation of the Arabic word for tar. Condensate was an essential ingredient of Greek fire, the secret weapon of Byzantium, and the ancient Chinese used natural gas to light their imperial palaces. These ancient cultures found petroleum by simply looking for oil seeps or gas seeps and hoping that an adequate source was nearby, but the search for oil and gas today is much more complicated.
Petroleum Geology
Several geologic elements are necessary for oil and gas to accumulate in sufficient quantities to create a pool large enough to be worth producing. These elements include an organic-rich source rock to generate the oil or gas, a porous reservoir rock to store the petroleum in, and some sort of trap to prevent the oil and gas from leaking away. Traps generally exist in predictable places - such as at the tops of anticlines, next to faults, in the updip pinchouts of sandstone beds, or beneath unconformities.
To find a convergence in the subsurface of the geologic elements necessary to form an oil or gas pool requires a careful blend of science and art. To discover what geometries and compositions the rocks might possess deep underground, geologists examine the rocks where they are exposed in surface outcrops, or they examine aerial photographs and satellite images when surface access is limited. Geologists also work closely with geophysicists to integrate seismic lines and other types of geophysical data into their interpretations.
The collection of seismic data involves sending shock waves into the ground and measuring how long it takes for the subsurface rocks to reflect these waves back to the surface. The shock waves that are used today are usually generated by pounding the earth with giant vibrator trucks, but in the past gephysicists preferred to explode small dynamite charges in shallow holes. However, environmental restrictions in most places today prevent using explosives to collect seismic data.
When shock waves created by the vibrator trucks travel into the earth, boundaries between the rocks reflect the waves back, and the arrival times of the waves back at the surface are detected by listening devices called geophones. Computers then process the geophone data and convert it into seismic lines, which are nothing more than two-dimensional displays that resemble cross-sections.
Seismic lines in the old days were just that . . . two-dimensional lines created by laying the geophones out in single line. But today, the data is commonly collected as an intersecting grid of seismic lines referred to as 3-D seismic volume. Data collected in this fashion may even be used to help create 3-D computer models of the underground geometries of the rocks.
Geologic and geophysical clues are enticing, but drilling is the only way to learn if an oil or gas field really exists. Once a well is drilled, well logs yield data on the types of rock present and, most important, what fluids these rocks contain. The information interpreted from the logs is used to decision whether a well should be completed and used to produce oil and gas, or filled with cement and abandoned. The logs are also used to update the geologic models originally used to locate the well.
Today, the average wildcat well has only one chance in ten of finding an economic accumulation of hydrocarbons. A rank wildcat, if drilled in a frontier area, stands only one chance in forty of success. The odds are much better for a development or extension well, but nothing is a sure bet in the oil business. Thus, even though explorationists (oil and gas prospectors) of today have better tools than their ancient predecessors, luck remains a significant factor in the search for oil and gas. The reality is that most wildcats turn out to be dry holes, in fact about 82% of those drilled. Also, not every development well becomes a producer, which demonstrates that nothing is a "sure bet" in the oil industry.
Anticlines - When layers of rock are folded to create a dome, the resulting geometry is called an anticline. Because oil floats on water, the oil tries to move to the top of the anticline. If an impermeable seal, such as a shale bed, caps the dome, then a pool of oil may form at the crest. Elk Hills field in the San Joaquin Valley is an example of an anticline. The valley actually has many fields that are anticlines. A few of the other anticlines are North and South Belridge, Buena Vista, North Coles Levee and South Coles Levee fields.
Synclines are the opposite of anticlines. In other words, synclines represent when the rocks are folded to create a downwarp or basin. Although there are examples of where oil is produced from synclines, they are not considered optimal places to look for oil.
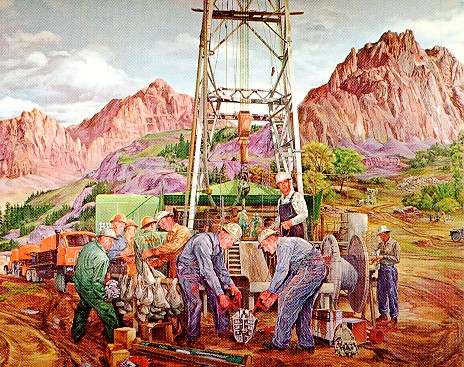
Drilling - The only way to find out if a trap contains oil or gas is to drill into it with a well. In the early days, wells were drilled with cable tools in which a heavy drill bit on a cable was repeatedly dropped up and down on the ground to literally "chop" a hole down to the trap. Today, we use rotary drilling in which a bit on the end of a length of drill pipe is rotated. A mixture of water and mud, called drilling fluid, is pumped down the pipe to flow through the bit. The drilling fluid, also called "mud", lubricates the bit, washes away the cuttings, and maintains pressure in the hole to prevent the well from becoming a blowout. The mud flows back to the surface through the gap between the drill pipe and the hole. This gap is called the annulus. Wells are very expensive to drill, and some deep wells may even cost millions of dollars.
Dry Hole - A well that does not produce enough oil or gas to make a profit and therefore needs to be abandoned. Dry holes are also known as "dusters".
Extension Well - A well drilled on the edge of an already producing field in the hopes of expanding the boundaries of the field.
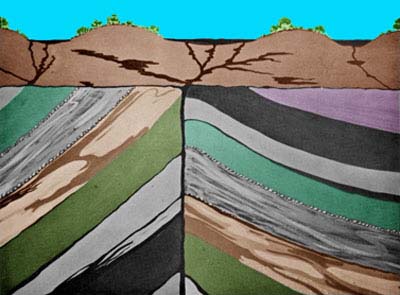
Faults - If a fault moves porous reservoir rock against an impermeable seal, such as shale or salt, and the fault does not leak, then the upward migration of oil to the surface is blocked, and an oil pool accumulates against the fault. Bellevue and Fruitvale two of many fields in the San Joaquin Valley that are fault traps. Belgian anticline, another field in the valley, is made up of several fault traps.
Geophones - Geophones are devices that measure how much and for how long the ground moves, as in an earthquake. In a sense, the data used to make a seismic line is collected by creating small earthquakes and then measuring them. Simple geophones, called 1-component devices, measure only up and down motion. Most geophones today are 3-component devices that also measure back and forth horizontal motions in two directions. In the water, we can use 4-component devices which measure pressure as well.
The shock waves that generate up and down motions are called pressure or compressional waves. They are called P-waves for short, and they are like ripples in a pond, but they move through the ground instead of through the water. Back and forth motions result from shear waves, which are called S-waves for short. Click here to learn more about seismic waves.
Permeability Barriers - If a reservoir rock suddenly loses porosity and permeability in the updip direction and becomes a seal, then a trap may result. The updip change may result from decreasing grain size, or from more clay or cement in the pore spaces. North Coles Levee field in the San Joaquin Valley is a small anticline, some might say just a wrinkle, on the east side of the giant Elk Hills field anticline. Some geologists think that a permeability barrier prevents the oil at North Coles Levee from leaking updip into Elk Hills.
Pinchouts - If a porous reservoir rock is encased within an impermeable seal, such as shale or salt, then a trap may form at the updip pinchout of the reservoir (i.e., where the reservoir thickness decreases to zero). The Gatchell sand in the East Coalinga Extension field in the northern San Joaquin Valley is an example of an updip pinchout.
Producing Well - Producing Well is a well that is used to produce oil and/or gas. Producing wells generally have pipe, called production casing, that is bonded to sides of the well hole, in other words to the rock on the sides of the hole, with cement. If the pressure inside the reservoir is high enough, then oil flows from the well to the surface on its own. However, most wells need help getting the oil to the surface. When "artificial lift" is used, oil flows into the well through holes in the casing that are called perforations and collects in the bottom of the well. Sucker rods connected to a pumping jack at the surface move up and down inside the casing to work a pump that is placed where the oil collects. These rods open up a valve on the downstroke and allow oil to flow in above the pump. This valve then closes on the upstroke to literally "lift" the oil to the surface. Because formation pressure alone is sufficient to bring gas to the surface, gas wells do not need pumping jacks.
Reservoir Rock - If a rock has enough porosity and permeability that oil or gas can flow through it, then the rock is a potential reservoir. Although the amount of pore space may not be very much, most rocks, in particular sandstones and conglomerates, have at least some porosity. If enough pores are present, the pores are large enough, and the pores are interconnected so that fluids flow through them (i.e., the rock is permeable), then the rock is a potential petroleum reservoir. With sandstones, a porosity of 18% or more is usually needed for an economic oil reservoir. Gas flows easier than oil, so as little as 12% porosity may be enough for a gas reservoir. Less porosity, perhaps as little as 9%, is enough if the reservoir is also fractured. Because of fracturing, limestone and dolomite reservoirs can have much lower porosities than sandstone reservoirs, yet be capable of producing greater amounts of oil.
Porosity and permeability are important, but a petroleum reservoir needs to contain hydrocarbons as well. In most reservoirs, the pores are filled entirely with a salty solution called formation water, but in a few reservoirs some oil or gas is present as well. A general rule of thumb is that 40% or more of the pore fluids must be hydrocarbons (i.e., the water saturation is less than 60%) in order for the reserovir to be economic enough to produce. If the water content is greater, then the oil tends to stay behind and the reservoir produces only water. These types of reservoirs are said to be "wet". If the water saturation is less, then the reservoir may be "productive". Whether or not it will be "economic" to produce and make any money will depend not only on the rate of production, but also on how long the well will produce.
Satellite Images - Petroleum geologists utilize many different types of data in the search for oil and gas. Seismic data and data collected from wells that have already been drilled are the staples of the industry, but surface outcrops, aerial photographs and satellite images are also important sources of data.
Satellite images are similar to photographs, but differ in that photographs record visible light only and do so in a fashion that resembles what our eyes see. By contrast, satellite images can record infrared and ultraviolet light, which we can't see, as well as the visible spectrum. Computer technology can then assign colors to the invisible spectrum to create an image that resembles a photograph. Thus, a satellite image can be made entirely from invisible radiation, or a mix of visible and invisible. The computer can also reasign colors, so that reds become blue, or whatever color you wish to represent them.
Below is an example of a satellite image of California. It is actually made up of a mix of infrared, visible and ultraviolet light, but colors have been assigned to the different frequencies so that the end result resembles a photograph.
Seal - In order for petroleum to be trapped in the subsurface, impermeable rocks of some sort need to be present to keep oil and gas in the trap and prevent the upward migration of these hydrocarbons to the surface. The impermeable rocks that fulfill this function are known as seals. Shale, salt, and cemented sandstones are all protential seals. However, as oil matures in the reservoir and becomes lighter and more buoyant due to the effects of temperature, it may eventually be able to overcome the effectiveness of a seal and start to leak out of the reservoir. Thus, rocks that were once great seals will start to leak when the day arrives that the bouyancy of the hydrocarbons in the trap exceeds the capillary entry pressure of the seal. However, once the buoyant hydrocarbons have escaped a seal may once again be able to trap hydrocarbons and create a pool of oil or gas.
Seismic Lines - When an earthquake or explosion happens, shock waves, also called seismic waves, travel through the ground and reflect off rocks in the subsurface the same way that ripples in a pond reflect off a boat in the water. Because boundaries between different rocks often reflect seismic waves, geophysiscists use these waves to generate pictures of what the subsurface looks like. It is much the same as using sonar to create a profile of the ocean floor, except seismic waves are used instead of sound waves. Dynamite explosions or vibrator trucks are used to create the seismic waves, and geophones laid out in lines measure how long it takes the waves to leave the seismic source, reflect off a rock boundary, and return to the geophone. The resulting two-dimensional image, which is called a seismic line, is essentially a cross-sectional view of the earth oriented parallel to the line of geophones.
Although seismic lines are two-dimenisional, in other words they reoresent a cross-section, it is possible these days to collect 3D seismic and 4D seismic data as well, where 3D data represents a volume, and 4D data includes the dimension of time. For example, two 3D volumes collected at different points in time would represent 4D data, and it could be used, for example, to look at the effects of steam flooding on a field over a period of time.
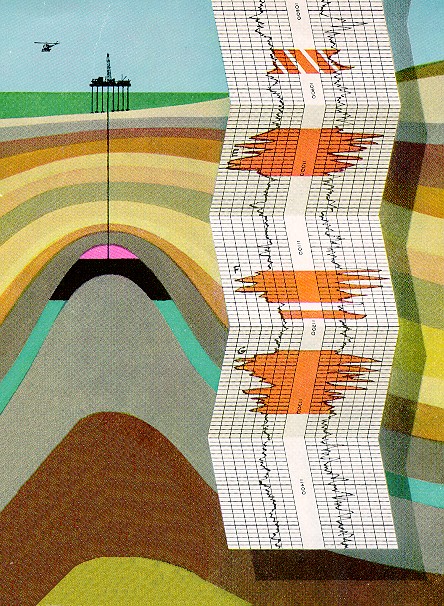
When seismic waves generated by dynamite or vibroseis reach a bedding plane separating rocks of different acoustic impedance (velocity * density), then a portion of the waves reflects back to the surface, causing the ground surface to rise or fall depending on whether the expansion or compression phase of the wave is being recorded. The remaining portion of the waves is refracted and diffracted. "Wiggle traces" (shown above) in a seismic line record the "two-way" travel time (from source generation to bed to geophone arrival time) of a reflected wave. An illustration of this concept is shown below.
Only a few years ago, most 2D seismic lines were variable area displays (see the example on the left) made of wiggle traces, in which each trace represents a geophone on the surface. Peaks and troughs on the wiggle represent up and down movements of the geophone, in which the vertical axis of the wiggle is the two-way travel time of the shock wave, and the amplitude of the peak or trough indicates the magnitude of geophone movement. Generally, peaks face right and are colored black to make it easier to interpret the line. In variable density displays, shades of gray are used to represent amplitude instead of peak/trough deflection.
The Society of Economic Geophysicists (SEG) has a convention that troughs represent upward motions of the ground, and the peaks represent downward motions. However, many companies have their own conventions, and it can all get quite confusing. At shallow burial depths, the troughs (upward expansion) often represent low-velocity sands, whereas the peaks (downward troughs) generally represent high-velocity shales. Yet with greater depths of burial, the sands become faster than the shales, which means that the troughs will switch to now represent shales. Thus, part of the job of a geophysicist intrepreting a seismic line is to first figure out what the polarity of their data is, and then decide if the peaks represent sands or represent shales - always bearing in mind that everything represented in the deep part of a seismic line may be completely the opposite of everything in the shallow part.
Today, dual-polarity displays of seismic data have largely replaced variable density displays and "wiggle traces". In most dual-polarity displays the troughs are colored red (to indicate low-velocity sands at shallow depths), peaks are colored black (to indicate high-velocity shales), and transitions between peaks and troughs are not shown at all. The troughs are then reversed, and superimposed on the original traces so that both peaks and troughs face the same direction. Dual polarity displays (see the example on the right) with variable density are also used, where different shades of red and black indicate the amplitudes. Although red and black seem to the most popular colors, dual-polarity displays can be made of course with any color combination.
Seismic Waves, which is another name for shock waves that travel through the earth, are the fundamental elements used to create seismic lines. To learn more about seismic waves, click here.
Source Rock - Most geologists agree that oil and gas form from the preserved soft parts of ancient organisms that were buried, and then broken down and converted into petroleum by the combined effects of heat and time. Buried organic matter is called kerogen, and a petroleum source is any rock that contains enough kerogen to generate oil or gas. Most source rocks are shales with a total organic content (TOC) of at least 3%. Short amounts of time and large amounts of heat can convert kerogen to oil, or long amounts of time and small amounts of heat. Most liquid oil forms from plankton, algae, or bacteria, and most gas is associated with oil. However, some gas forms directly from "woody kerogens", such as pollen or other plant remains, or from oil that has been broken down by too much time and temperature.
Most oils in California are sourced by shales of the Miocene Monterey Formation. The most organic-rich Monterey shales are those in in which the kerogen is the preserved soft parts of diatoms, microscopic plants that live suspended in the upper few meters of the ocean. Most Monterey kerogens are also high in sulphur, and because sulphur bonds break easier than caron-oxygen bonds, Monterey shales tend to generate oil at lower temperatures than other source rocks.
3-D Computer Models - These days, many oil companies use sophisticated computer programs to create three-dimensional computer models (lower left) of the reservoirs they produce oil and gas from. These models can simply show where the different faults and rock types are within the reservoir, or they can show things such as the distribution of porosity within the reservoir sandstones. The beauty of 3D models is that they can be sliced in any direction to produce two-dimensional views (lower right), including cross-sections (vertical views) and maps (horizontal views). The view below is a cross-section.
3-D Seismic - A 3D seismic volume or cube is created by shooting a closely spaced grid of 2D lines and interpolating between the lines to create a "3-dimensional volume" of data that is also referred to as a cube. This volume can then be be sliced in any vertical dimension to create 2D lines, or sliced in horizontal plane to create time slices, which represent constant time. The volume can also be sliced along reflection boundaries to create "horizon slices" that, more or less, parallel bedding.
4-D Seismic - 4D seismic is the term used for 3D sets with identical spatial configurations that are shot at different times for the purpose of examining the change in a reservoir over time. Sometimes the term "4-component seismic" is used, which means the geophones record not only vertical earth movements, but two directions of horizontal movement, as well as pressure within the sediment or water column. 4-component seismic is used in acquiring marine data only...
Trap - Petroleum reservoirs contain interconnected pores filled with water and hydrocarbons (oil and gas). Because most oils are lighter than water, they migrate upward through the pores, or along and faults and fractures, and make their way to the surface to discharge as oil seeps (click here for a picture of a seep). The exception is when a seal exists, some sort of impermeable barrier, that prevents the upward migration of oil. Shale, salt, and cemented sandstones are all protential seals.
If the geometry is such that a seal forms a trap, such as in an anticline, then oil accumulates behind the trap to form a pool which, if large enough, can be produced. Oil will continue to migrate into the trap until the base of the pool reaches a spillpoint, where the excess oil escapes to renew its upward journey to the surface. Traps may also be formed by faults, pinchouts and unconformities.
Traps are classified as to whether they are structural or stratigraphic. Traps formed by anticlines and faults are examples of structural traps, and traps formed by unconformities and pinchouts are types of stratigraphic traps. Permeability barriers are another type of stratigraphic trap.
Diagenetic traps also exist, where phase changes from one rock type to another may create a reservoir or a seal. Diatomite reservoirs in the San Joaquin Valley are an example of a diagenetic trap, with Opal A and Quartz phase rocks representing reservoirs, and Opal CT phase rocks representing seals.
If a trap possesses both structural and stratigraphic elements, then it is a combination trap. For example, the pinchout in the cross-section above shows a combination trap made up of an anticline that also contains a stratigraphic pinchout on the right flank of the structure. Many of the anticlines in the San Joaquin Valley are large structural traps, that also contain smaller combination traps similar to this pinchout.
Unconformities - An unconformity is a surface of erosion. If reservoir beds beneath an unconformity are tilted, and impermeable beds above the unconformity form a seal, then a trapping geometry results. The giant Midway-Sunset oil field in the San Joaquin Valley is an example of an unconformity trap. Prudhoe Bay field in Alaska is another.
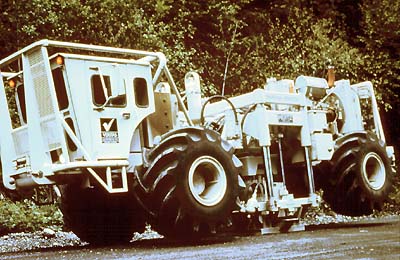
Vibrator Truck and Vibroseis - In the old days, seismic lines were acquired using dynamite as the energy source. Today, most onshore seismic data is acquired using vibroseis, where the energy source is a giant vibrator truck in which a pad in the middle of the truck rests directly on the ground to raise the truck so that the pad supports the full weight of the vehicle. The truck then vibrates to put energy into the ground. If your computer can play shock wave files, then click here to see an animation of the process in action.
Well Logs - To determine what types of rocks are in a well, geologists and engineers typically use well logs, which are simply measurements of various reservoir properties, such as density or resistivity, plotted versus depth. Well logs are usually made by lowering a measuring device to the bottom of the hole, and then measuring the reservoir properties as the device is raised to the surface. Most of the time, the data is transmitted, as it is collected, back to the surface through the same cable that was used to lower the logging tool into the well. There are many different types of well logs, most of which are idenitified by a confusing array of acronyms.
Wildcat Well - An exploratory well drilled a mile or more from existing production. If the well is drilled in a frontier area where there is no existing production, then it is a rank wildcat.

 History of the Oil Industry

 Several geologic elements are necessary for oil and gas to accumulate in sufficient quantities to create a pool large enough to be worth producing. These elements include an organic-rich
 Synclines are the opposite of anticlines. In other words, synclines represent when the rocks are folded to create a downwarp or basin. Although there are examples of where oil is produced from synclines, they are not considered optimal places to look for oil.
 Producing Well
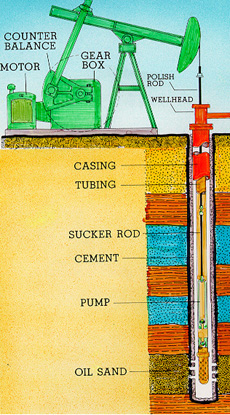 Producing Well is a well that is used to produce oil and/or gas. Producing wells generally have pipe, called production
 If the geometry is such that a seal forms a trap, such as in an
