Stratigraphy of the San Joaquin Valley
Geologic Formations
The section below runs from NW to SE across the valley and shows some of the stratigraphy. Coalinga field is on the west side of the Valley, Elk Hills is in the middle, and the Bakersfield Arch is on the east side. The stage names shown on the cross-section are local names that are based primarily on benthic (bottom-dwelling) forams.
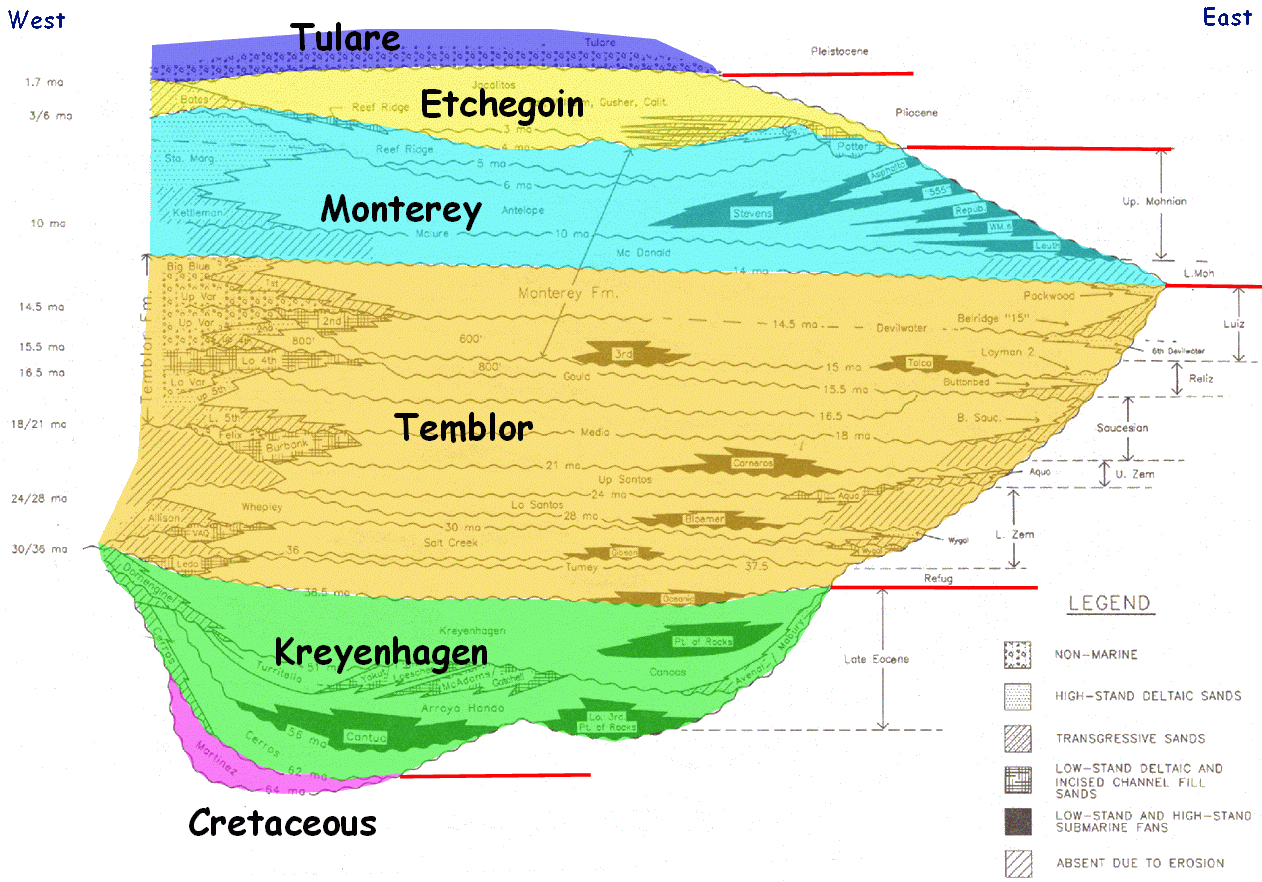
Sequence StratigraphyClassical stratigraphy divides the subsurface into lithologic formations based on which ones are sand and which are shale. By contrast, sequence stratigraphy divides the subsurface up on the basis of time, where everything below a sequence boundary is older than everything above the boundary. The interpretation below by Dave Calloway (1990) shows six megasequences (2nd-order) in color superimposed on several smaller (3rd-order) sequences.
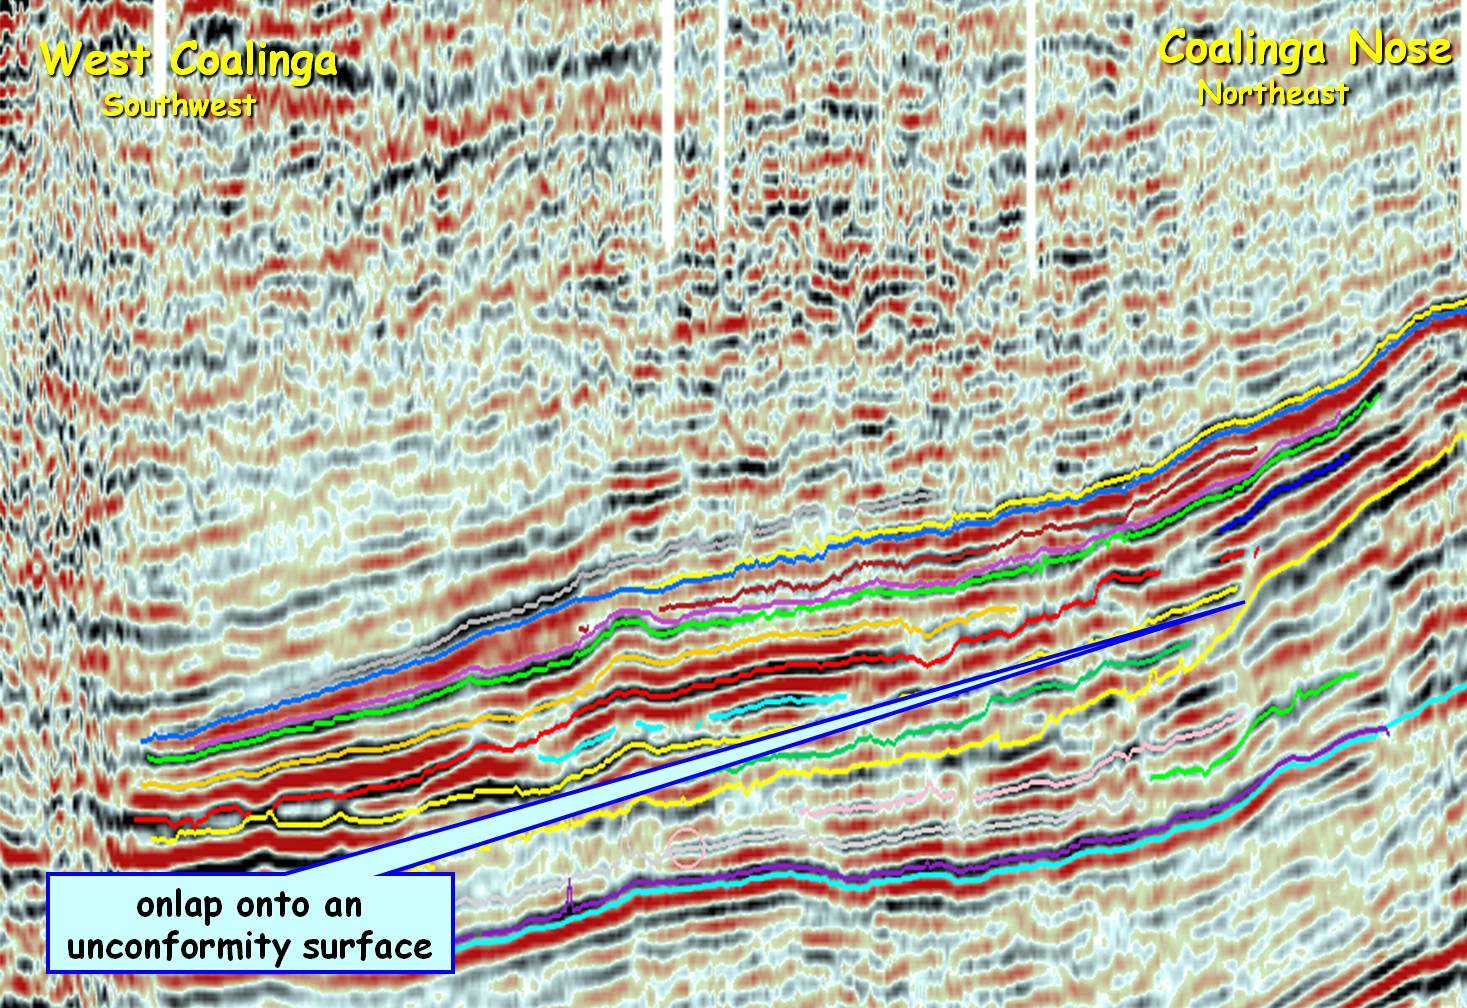
Seismic StratigraphySeismic stratigraphy is based on the premise that seismic reflections are time-lines that can be correlated to the geologic time scale, and used to determine the ages of units in the subsurface. Age determinations in the "old days" were largely based on microfossils, such as forams, but these days seismic data, particularly 3D seismic data, is routinely used for the same purpose. This has led most oil companies to greatly reduce, and in many cases completely eliminate, their paleontology staff. Although seismic stratigraphy is how most geologists make correlations in the subsurface today, the seismic data still needs to be calibrated to something, and the microfossil data, particular foram data, is what is most widely available.
The seismic line above has different colored lines drawn on the seismic reflections. These lines represent different bedding units. Notice also how the reflection geometries indicate an onlap surface on the northeast side of the line with beds lapping onto an unconformity surface represented by the yellow line. Part of the reason that seismic data has replaced micropaleontology data in the oil industry is that the seismic data not only allows for correlation of the subsurface units, but it also provides a picture of the subsurface geometries. The caveat is that seismic data is very interpretive and lots of things can produce "false reflections" that are not real. Thus, seismic data is most valuable when used as one part of an intergrated data set that includes the fossil data, in addition to other independent data sets.
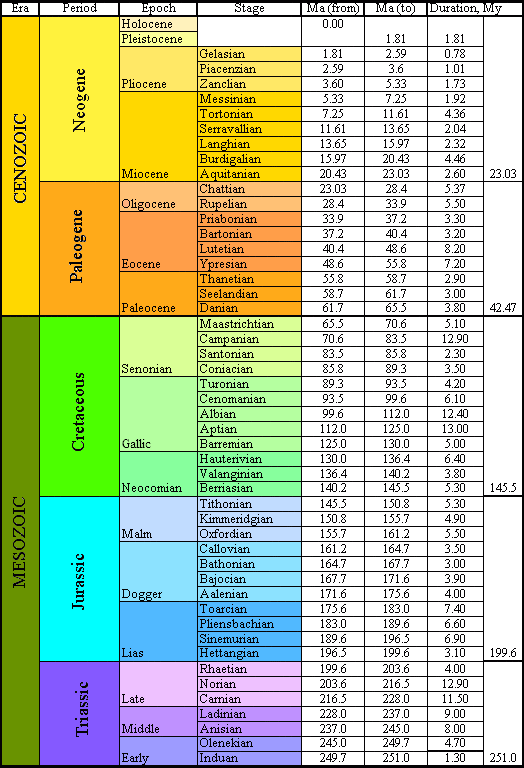
Geologic TimeThe chronostratigraphic chart below covers only the Mesozoic and Cenozoic eras, as nothing in the San Joaquin Valley is older than the upper Cretaceous, with the exception of some basement rocks that may be Jurassic in age. The button below leads to a much more detailed geologic time scale that includes stages and micropaleontolgy zones specific to California,
Paleontology
|
|
 The
The 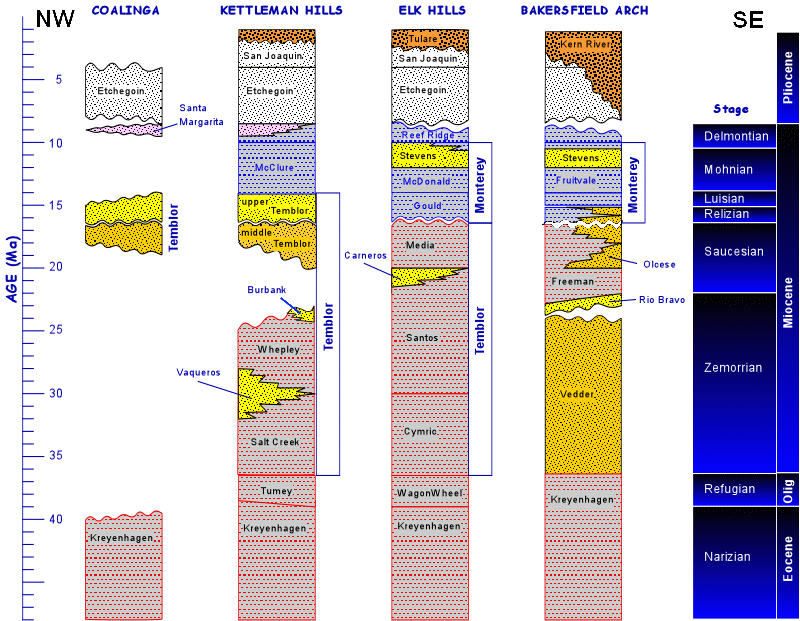
 Paleontology is the study of fossils, and fossils are what geologists use to calibrate the